
What is EDA?
A brief overview of Exploratory Data Analysis.
What is EDA?
Whenever we are presented with a new set of data it is very important to become familiar with the data. In a nutshell that is what EDA is. EXPLORATORY data analysis. Think of yourself buying a new car. Usually one does not just pay the money and take off like a racecar driver in the car without becoming a little familiar with the car beforehand. If I were buying a new car I would want to spend some time with it, walk around it, sit in it, look under the hood and take it for a short test drive. That way I can get a good feel for the car before I buy it and go speeding off in it. This the purpose that exploratory data analysis is accomplishing whenever we are presented with a new dataset and some questions that we’re trying to answer. Before getting over-anxious, jumping right in and fitting models to our data set, it is always a good idea to explore the data first to check the general structure for things such as linearity and potential relationships between our response and explanatory variables. Just like checking out a car before we speed off in it.
The Data
For this post we’re going to be performing an exploratory data analysis on a data set about baby’s birthweights. A baby’s weight at birth is strongly associated with various developmental problems and overall health of the child, which is why analysis of this data is important. The main purpose for analyzing this data would be identify or discover if the explanatory variables int this data set of Mother’s age, gestational age, mother’s race or gender of the baby have any effect on the response variable, birth weight.
EDA
The goals of the study would be to see if risk of a low birth weight would increase with the mothers age, differences among weights from mothers of different races expected birth weights and being able to predict birth weights. Being able to answer these questions is important to further prevent developmental problems in newborns and promote the overall health of the child.
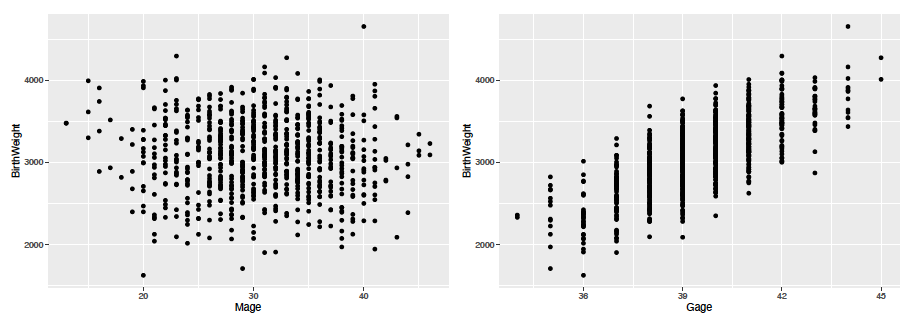
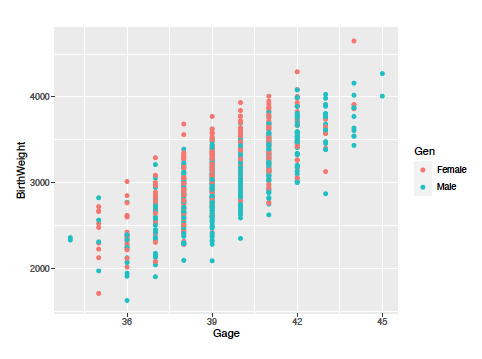
Examining the somewhat intuitive aspects of the data we can see that at a glance the mothers age does not seem to effect the brith weight of the baby. And also as the gestational age is older the birth weight is also higher. We can also look at another version of the second plot above with the points colored based on gender of the baby. In this plot we can see that in general, male babies tended to have a lower birth weight than female babies.
However in examining various plot comparisons of the variables, I found one that could prove to be interesting to look further in to, which is a boxplot of race vs birth weight:
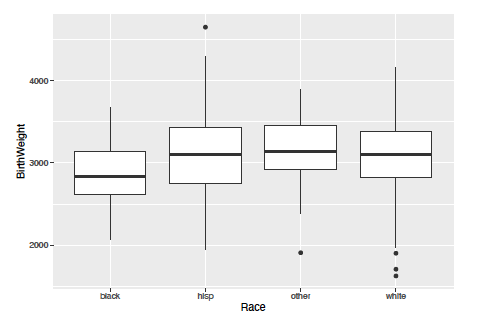
To me it would be interesting to see if the differences in these plots are significant in any way. if we use the function ggpairs in R we see multiple plots comparing each variable in the study. However none of these plots stands out in a way that I would believe to be significant with my knowledge at this point in time.
Wrap-Up
In general the only data that would be worth-while fitting to a linear model would be birth weight and gestational age because they are the only variables that when compared appear to be linear. Which means that as one variable increases, the other does as well. The formula I would use to create this basic linear model is:
birth.lm <- lm(BirthWeight ~ Mage + Gage + Race + Gen, data = mydataset)
One of the ways that we can check to see if this model may be a good fit is by examining a histogram of the residuals:
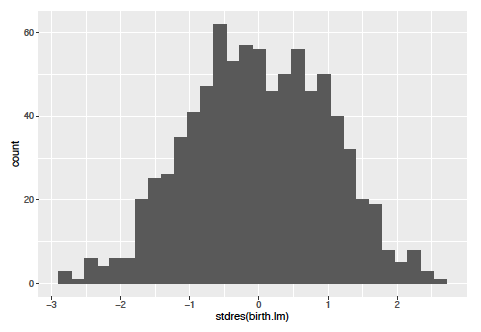
As you can see this plot looks very normal in shape which tells us that this model could be a good one to use going forward.
The variables of birthweight and gestational age have a strong correlation of ~0.75, and as far as correlation within observations, there would not be any unless perhaps the mothers were related, or if two babies came from the same mother.
And that is basically it for an EDA! Because this is just an exploratory process there’s no reason to make predictions or fit an accurate model yet because we’re just trying to get a feel for the data. We’re becoming familiar enough with it to form some general opinions and make sure general assumptions about the data to give us a baseline to go into the analysis with.
if you want to check out the code that I used to create these plots and perform this eda you can go this Github repository